Imagine being able to predict the future, to know what your customers will be interested in before they even know it themselves.
Sounds like a dream, right?
Well, wake up and seize the opportunity because Google Trends is your new best friend.
This free tool can give you an insider's look into the consumer's mind, showing you what's hot, what's not, and what's about to be.
With this knowledge, you can stay one step ahead of the competition, optimize your content for search engine rankings, identify seasonal trends to plan your marketing campaigns and create timely, relevant content that resonates with your target audience.
So, get ready for our 3 actionable and easy ways Google Trends can turbocharge your small business marketing – right now!
Prefer to watch a video of this?
1
Use Google Trends To Stay Ahead of Your Competition
For example, Let's consider a med spa that offers a variety of aesthetic treatments (related post here on medical spa marketing ideas).
The med spa owner can use Google Trends to monitor the popularity of different aesthetic treatments. They enter search terms like "chemical peels," "Botox," "microdermabrasion," etc., and filter by location and time range to get the most relevant data.
Below is a chart showing the last 12 months of interest data about "chemical peels."
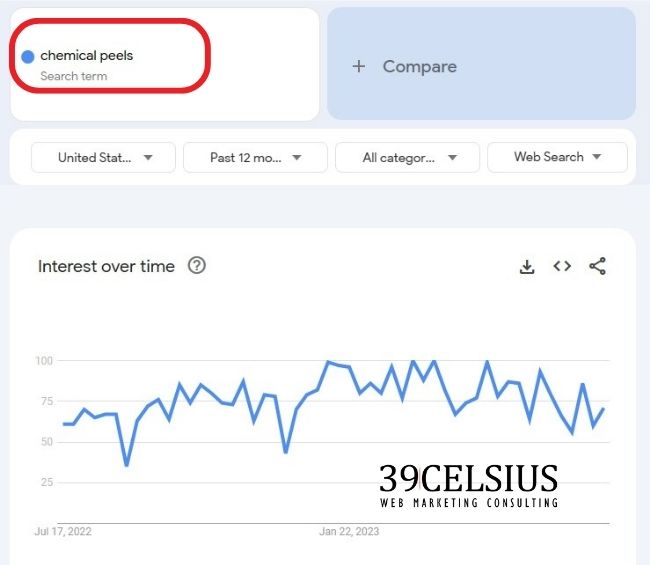
How To Use Google Trends - Stay Ahead of Competition. Here we searched in the last 12 months within the U.S.
Below this line chart in Google Trends is a section for Related Queries.
Let's say the owner notices there's a growing trend for "microneedling" after searching “Chemical peels.” They now have valuable insight that they can capitalize on.
Here’s what that looks like in Google Trends - you can see the breakout topic of “how much is microneedling.” And additional terms that are growing significantly in interest as well.
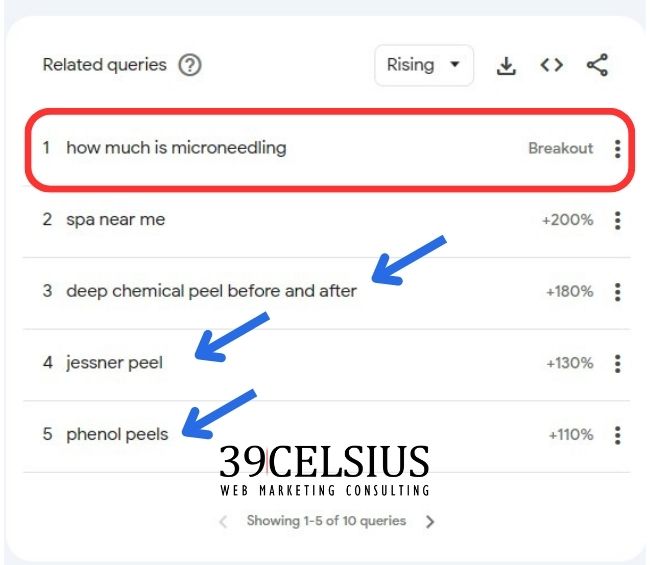
How To Use Google Trends - Breakout Terms and Topics
The primary benefit here is the ability to make data-driven decisions.
The med spa owner could decide to promote mirconeedling treatments more heavily or even create a special offer around this service, knowing that there's growing interest in it.
By using these insights, your business can ensure it offers the treatments that customers are actively interested in, increasing the likelihood of booking appointments.
Additionally, the med spa owner can create content around "how much is microneedling" - blog posts, social media updates, email newsletters, etc., which can improve med spa SEO efforts and drive more organic traffic to their website.
Keep in mind the following:
Firstly, trends can change quickly. What's popular today might not be popular in a few months. So, there's a risk that if the spa invests heavily in promoting a specific treatment, the interest may wane.
Secondly, Google Trends provides an overview of search interest but doesn't provide specific numbers or volumes. So, while it's helpful for spotting trends, it shouldn't be the only tool used for making significant business decisions. But it gives us a great place to start.
2
Use Google Trends To Uncover New Keywords, Topics
Let's take the example of a small business that operates a local vegan bakery.
The bakery owner can use Google Trends to discover new keywords related to their business (related post here on how to choose keywords for SEO). They might start by entering search terms like "vegan bakery," "vegan cakes," "gluten-free vegan pastries," and so on.
Below is a chart showing the last 12 months of interest data about "vegan cakes."
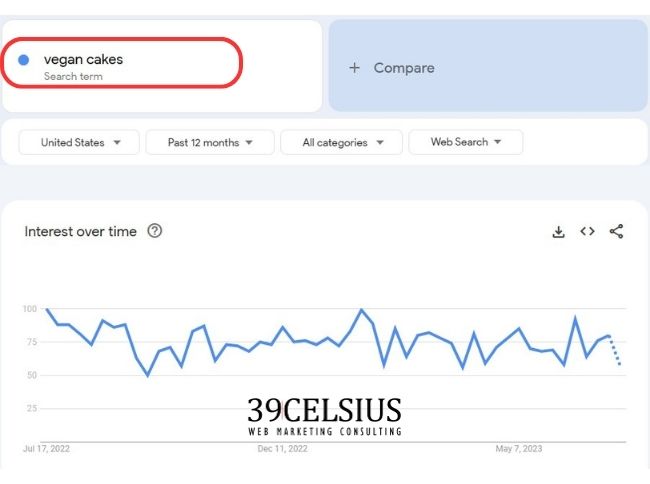
How To Use Google Trends - Discover New Keywords
As they explore Google Trends, they might notice rising interest in a related query like "vegan cake mix," as shown below. The search phrase, vegan cake mix, has seen a 250% increase in interest! This represents a new keyword that perhaps the owner hadn't previously considered.
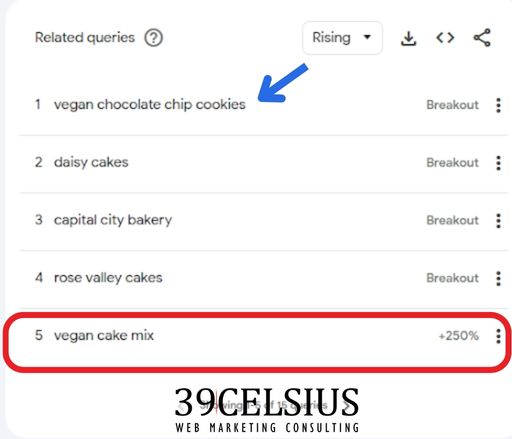
Google Trends - Uncover New Search Terms
Moreover, they could create specific marketing campaigns or special offers around "vegan birthday cakes," knowing there's growing interest in this area. This could lead to increased sales and customer engagement.
3
Using Google Trends To Uncover Seasonality and Declining Demand
A trend in the beauty industry is eyelash extensions. Below is a Google Trends chart for that query.
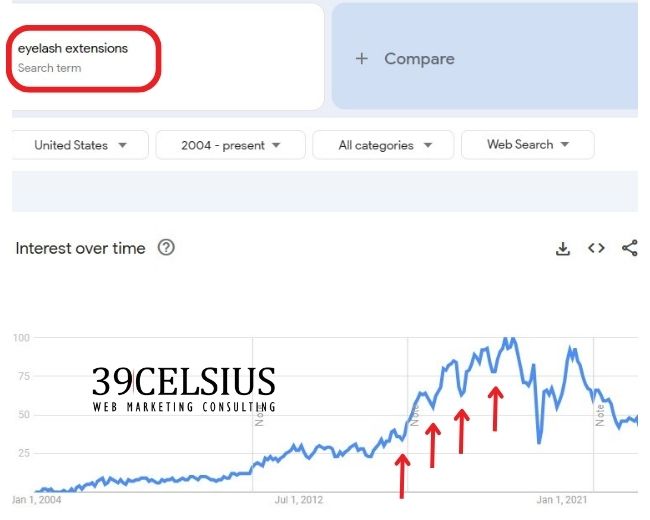
How To Use Google Trends - Uncover Seasonality Trends and Interest. The red arrows are the low point in interest in the late fall for that particular year. The big dip in 2020 is Covid.
There are several trends here that are apparent.
First, peak interest is in the summer months of June - August. Then, from later summer into the fall, interest drops to its lowest point each year (represented by the red arrows). Then interest picks up again in the late fall and grows every month until the following summer. This cycle happens like clockwork every year. (Related posts here on Google Ads for beauty salons and Facebook Ads for Beauty Salons)
The Covid year stands out here as that big drop, but we can discount that as an anomaly.
How Can I Use A Chart Like This for Better Decision Making?
- 1Marketing Insights: You can clearly see when interest is strong and weak throughout the year. Knowing this helps you plan promotional strategies for your business.
- 2Sales Predictability: What happens like clockwork is that management becomes nervous during the down months because sales drop and they aren’t sure why. They will say things like, our marketing isn’t working. Sales are down. Something is off. But when looking at this chart, it’s clear there’s an industry-wide annual seasonal shift in interest that happens each year at the same time. This explains the drop in sales in the fall. And likely, nothing is wrong with marketing.
- 3Content Planning: By identifying when interest in specific topics peaks, you can schedule your content accordingly. For example, we know that demand increases in the late fall, so before that period, you can plan content to amplify that seasonal growth in interest.
- 4Uncover Larger Industry Trends: From the chart, it’s clear that post-Covid, interest overall has fallen significantly. Before Covid, interest had been growing steadily year-over-year since 2011. Post covid, the story is different. Interest has tanked, and it has not rebounded. As a matter of fact, interest overall has fallen back to where it was 8 years prior! If I was in the industry, I would definitely re-evaluate my business strategy and uncover what’s behind this long-term dip.
Limitations of Using Google Trends
While Google Trends is a valuable resource, its insights should be used in conjunction with other tools and data for a complete understanding of market trends and customer behavior.
Summary
Overall, use Google Trends as a regular tool in your marketing toolchest. I use it daily and find it invaluable for providing broad direction and ideas around topics.
Like a crystal ball revealing the consumer's mind, Google Trends grants you backstage access to what's hot and what's next.
So, my entrepreneurial compadres, seize this golden insight to outpace competitors, align marketing campaigns to upcoming trends, optimize web content, and forge deep connections through relevance.
Onward!

